On the Diagnostics page you can find the tools to check the overall status of your system. It allows you to monitor and test your setup to identify faulty units and help you solve issues. To access Diagnostics click the icon ![]() in Main menu.
in Main menu.
On the Diagnostics page you can perform different actions. The image below gives an overview of all possible actions. The sections that follow give a detailed description how to use all these features.
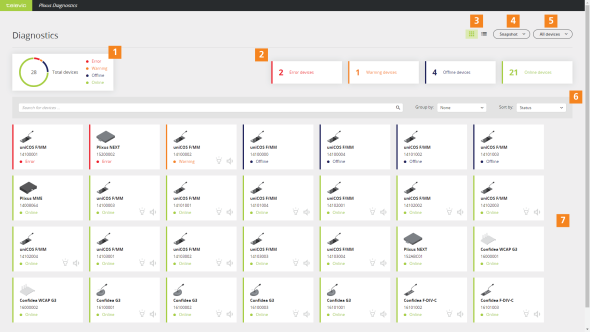
Figure 1-75 An overview of the Diagnostics page of the CoCon web server
The Diagnostics application has different options to filter out specific devices.
On top of the application there are four filter buttons available:
Select one or more of the buttons to add the devices to your selection in the device overview section. Once you click a button, it becomes highlighted. Click the button again to remove the devices from the selection.
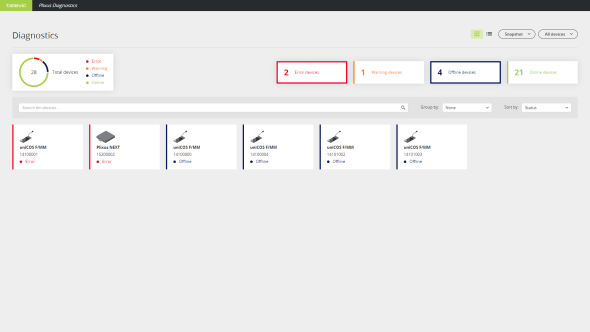
Figure 1-76 How to use the filters in the Diagnostics application. Two filters are active: devices with error and offline devices.
You can use the search bar to find specific devices. You can use the device type or serial number to find specific devices. The search function works dynamically and the search result updates in real-time while you type.
In the Diagnostics application, you can group devices based on the loop/branch they belong to. With this option, you can see when a loop is broken because then the loop becomes a branch. To see the loops/branches select Loop/Branch under Group by next to the search bar.
For every loop/branch, you can see the serial number of the device the loop/branch starts/ends in the header of the group. The order of the devices in the overview is the same as in the actual loop/branch present in the room. For a loop, this means that the first device in the list, is directly connected to the first device in the group header and the last device in the list is connected to the second device in the group header, as shown by the orange line in the image below.
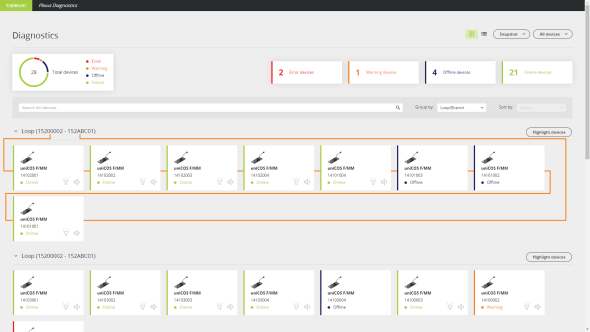
Figure 1-77 The order of the devices in the loop/branch group corresponds to the actual order of the units in the setup, meaning the first device is connected directly to the device next to in the visual representation
When you click a device in the overview with all devices, a window pane appears on the right. This pane shows the following device information:
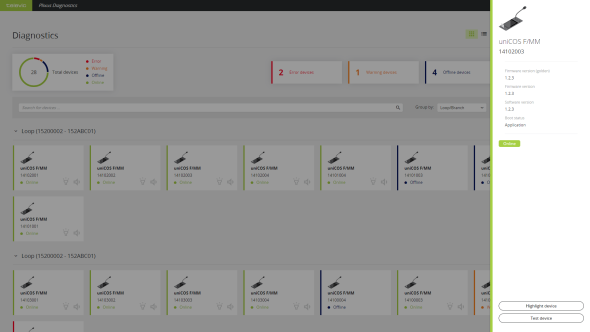
Figure 1-78 Device details pane in the Diagnostics application
CoCon offers a useful option to highlight one or more devices in your system. Highlighting devices allows you to identify specific devices in your setup and see where they are located in a loop or branch. When you highlight a device the LED ring of the microphone and the LEDs next to the microphone button light up.
There a two options to highlight a single device:
To highlight all devices at once, click the button All devices in the upper right corner and select Highlight all devices. This highlights all online devices without errors that support this feature. To stop highlighting, clich the button All devices again and select Stop highlighting all devices.
In Diagnostics it is possible to visualize devices as branches and loops. For more information on how to do this see "Visualize loops and branches"
Next to every loop or branch, you can find the button Highlight devices. Click this button to highlight all devices in this loop/branch. In the loop/branch you can stop highlighting individual devices to see which device is which in your setup.
Using the Diagnostics application, you can test devices. In Test mode, you send a sinus test tone to the device you want to test. The speakers of the device you are testing should then play this tone. You can also test the microphone of the unit, the loudspeaker of the other units then play the audio captured by the microphone of the tested device.
There are two options to test a device:
In test mode, you disconnect from CoCon. Therefore a popup appears to confirm you want to go into test mode. When you are in test mode, the browser displays an orange header indicating the system is in test mode. In this header, there is also an option to disable the test mode. You can also disable the test mode by clicking the test icon ![]() again.
again.
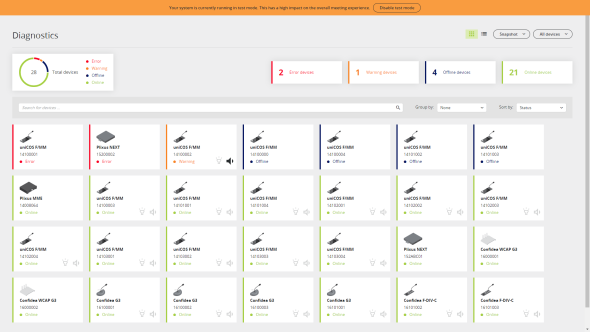
Figure 1-79 The Diagnostics application in test mode. The orange header on top indicates that the system is in test mode.